Road To Nowhere | Investors Still Finding Their Footing on the Path Forward

Another year has gone by, and we still find ourselves asking the same question: “Are we there yet?” It’s been a turbulent ride for the last several years to say the least, an adventure that brings us back to our adolescence, sitting restlessly in the Family Truckster, itching to know when we’d finally arrive at our destination. Or maybe just wondering, “Where exactly is the destination we are supposed to be looking for?”
The Great Thaw?
As it usually does, any economic question starts with interest rates. The decoupling of monetary policy continues globally and reverses a trend of synchronized rate movements from the world's central banks for the better part of the last 15+ years.
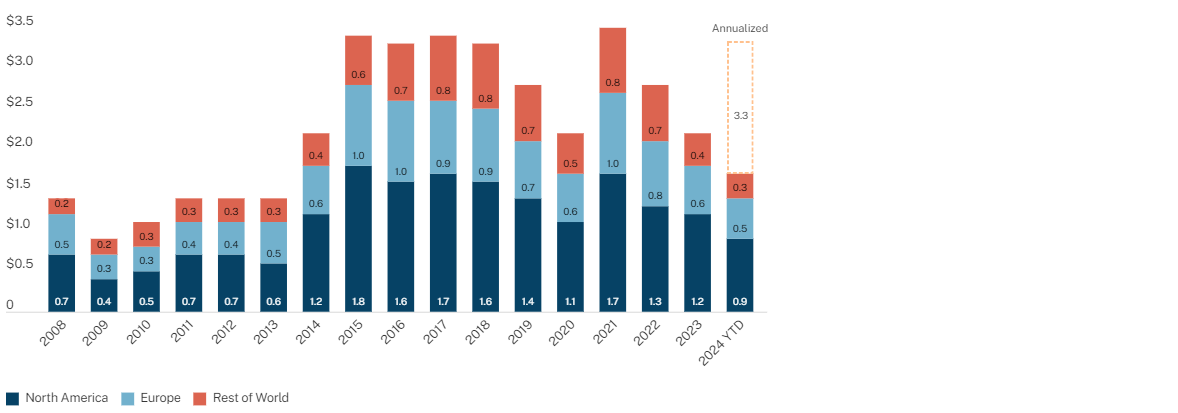
That said, developed market economies are likely to face a choice between ‘keeping it in neutral’ – with a slower-to-lower policy in the U.S. driven by continued economic growth and a stubbornly resilient consumer – or swifter cuts, as you are starting to see in other parts of the world, including a greater magnitude and quantum of reductions expected through most of Europe. These monetary policy factors will likely accelerate deal making.
Similarly, with greater clarity that, globally, further rate increases are less likely, the lingering ‘buyer-seller’ pricing gap that comes with heightened rate and inflation uncertainty can start to be bridged.
Global M&A Volume Expectations
In Trillions
Credit Markets Opening Up, Too
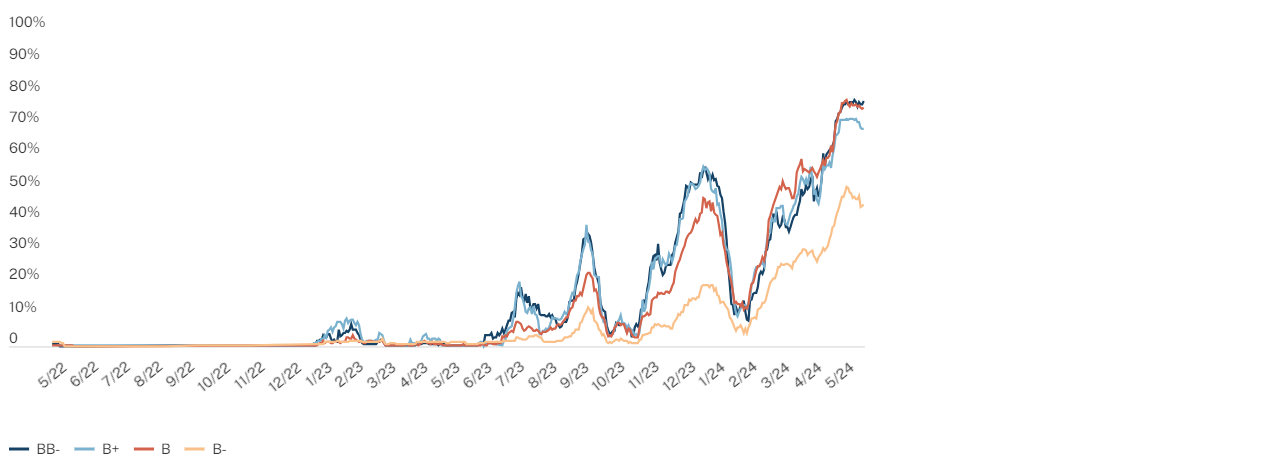
The credit market, especially listed credit, tends to be a good leading indicator of expected deal activity momentum. New debt issuance across high yield and leveraged loans has accelerated meaningfully compared to last year, showing increases of close to 80% and 140% YTD, respectively. In the current environment, dividend recaps and even second-lien credit tranches (remember those?) are now open for business as well. Spreads are compressing modestly. In short, both the banks and private lenders are keeping busy, and it shows in the tenor of the debt markets.
Loans Priced at Par and Above by Rating
% Loans priced at par and above by issuer rating
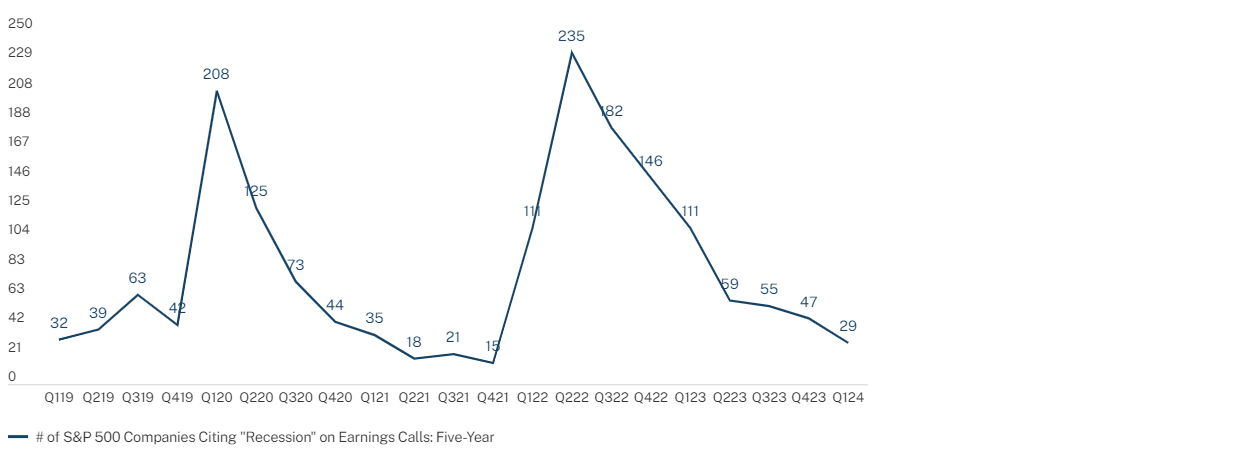
Finally, current investor sentiment also reflects the context of where we have been over the past several years. Notably, a consideration by some that perhaps the worst is behind us. Just take a look at the mention of the word ‘recession’ on S&P 500 earnings calls over the past two years – there’s been a dramatic drop-off. This correlates to CEO surveys that are consistently showing higher levels of optimism on the economic front, driven by expectations of strong continued corporate earnings growth.
Number of S&P Companies Citing "Recession" on Earnings Calls: 5-Year
Liquidity - Turn on the Spigot
We also said last year that activity and, in particular, liquidity would be one of the upside surprises in 2024 for private markets investors. Our expectation, based on our own transaction pipelines and planned portfolio exit activity, was that distributions from diversified private market portfolios would pick up momentum. Cash generation for investors would get closer to longer-term annual averages.
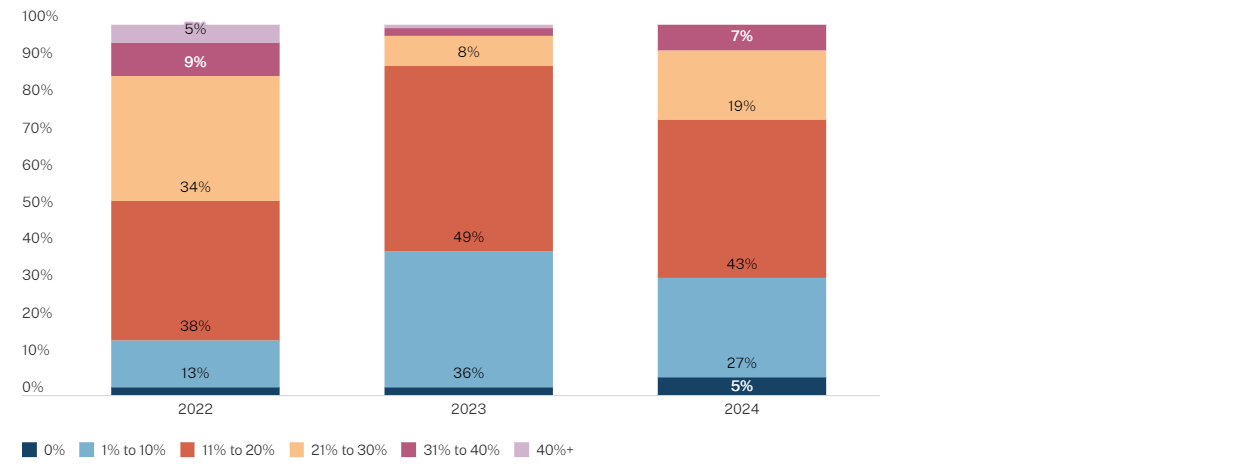
General Partner Expectations: What are the GPs and owners of all these private businesses anticipating? Well, as one might expect, the rose-colored glasses remain heavily tinted. Maybe for good reason; fundamental operating performance continues to be strong and, with a rebound in valuation multiples more recently, it shouldn’t be a surprise that GPs are looking to provide the liquidity that their investors are so desperately seeking, particularly as distributions in equity portfolios have been hard to find over the past 18 months or so.
General Partner Survey: What percentage of your current portfolio is actively pursuing an exit process with expected closings in the next 12 months?
Results So Far: Where does that leave us today? Exit volume is up. For the YTD period through June, investor distributions of over $200 billion from buyout strategies alone represent an increase of nearly 50% compared to the same period last year. Perhaps the GP's crystal ball is working. Perhaps GPs are heeding the call for more liquidity from their investors. Perhaps this is the result of a more accommodating financing environment. Do all these signs point to risk-on? Potentially. Our expectation is that this momentum will continue. Keep in mind that, typically, the back half of the year, particularly Q4, tends to generate more robust exit volumes. Thus, the second half of 2024 is shaping up to be a busy one. Buckle up.
Objects in Motion Tend to Stay in Motion…
Activity is one thing, but what about performance?
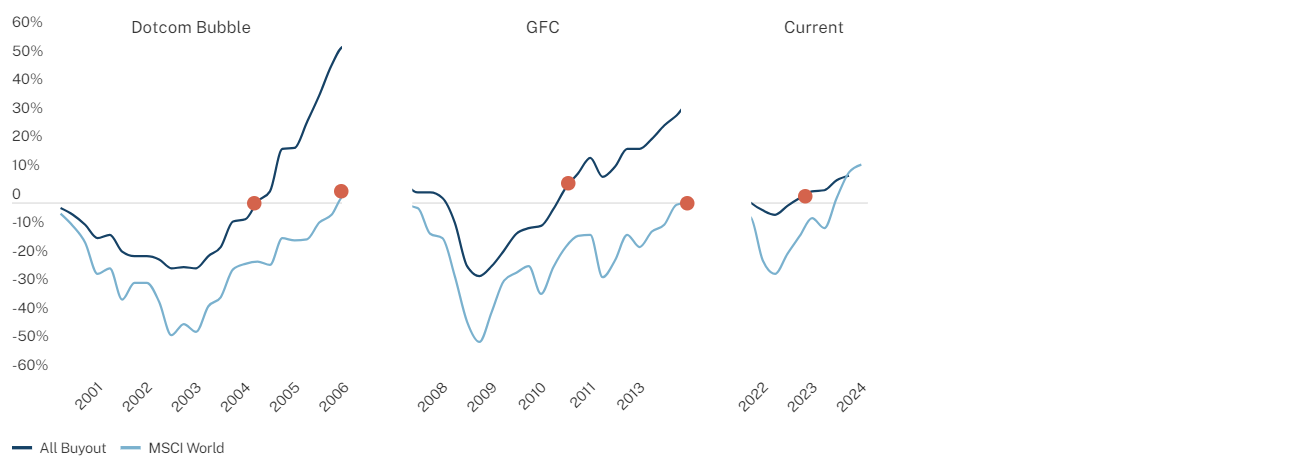
The most recent economic trajectory has exhibited a faster snap-back in performance compared to the more ‘fundamental’ global downturns of the dot-com era and the GFC. There was also a shallower dip this time around (as shown in the chart below), likely driven by factors such as continued strong corporate growth, healthy margins and cash flows. Combine that with strong balance sheets for both consumers and businesses, as well as a stable employment picture, and there is good reason to believe that the upswing of economic expansion will continue broadly. While geopolitical uncertainties, remilitarization and economic decoupling remain key risks globally, in major world economies, these forces should be inflationary.
You can also see two clear historical trends based on the chart below. First, that the public and private equity (buyout) performance indices are highly correlated in their movement. Secondly, more muted volatility and the lagged directional performance trajectory of private equity comparatively. Given the strong YTD performance of the listed equity markets, this suggests that there could be further room for value appreciation across the private equity index in the coming quarters.
Buyout vs. Global Equities Cumulative Returns
Things To Think About
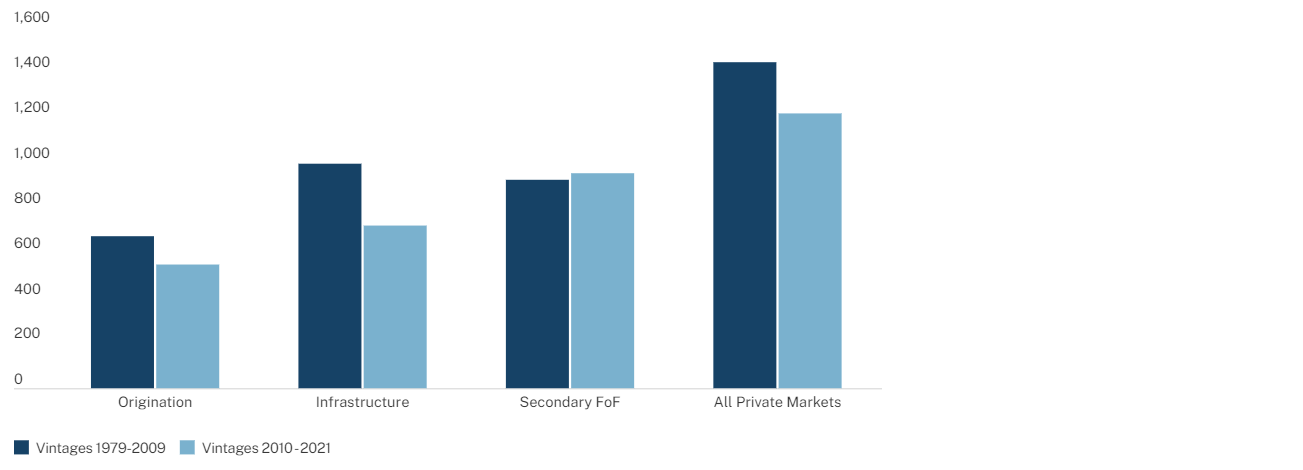
1. Risk mitigators. We have said it before: Shortened duration and enhanced liquidity are great tools in choppier, more volatile environments. Investors would do well to continue layering in strategies that exhibit these characteristics. In our earlier white papers, we explained how private credit, infrastructure and secondaries would continue to be useful tools in this context. Following those strategies four years ago as suggested would have paid off handsomely.
Dispersion of Returns by Strategy By Vintage Year Groupings
2. Equity upsides. With at least some newfound comfort that economic momentum is likely to continue globally, perhaps not surprisingly, more investors have started to focus on leaning back into 'risk-oriented' investment strategies. The sentiment appears that investors' worst fears have subsided somewhat. In particular, the middle-market buyout space represents an interesting way to target asymmetric upside in equities. There should be greater alpha-generation potential in this segment given a more target-rich environment for middle-sized companies compared to the large and mega end of the private company spectrum. And the performance data validates this view. Specifically, fundamental operating metrics in middle-market private equity buyouts tend to be stronger on average.
Median Revenue Growth
Deal Vintages 2003 - 2023, Realized Deals Only

Source: Hamilton Lane Data (March 2024)
Median EBITDA Growth
Deal Vintages 2003 - 2023, Realized Deals Only

Source: Hamilton Lane Data (March 2024)
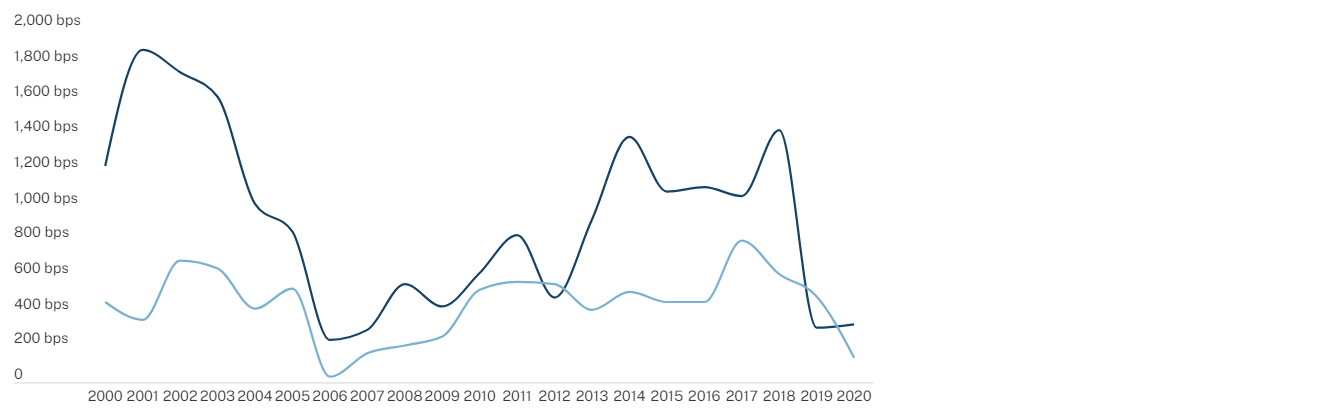
3. Don’t sleep on Europe. Just like most things, investment selection is all relative. Context is important, and there are always considerations and tradeoffs. Over the past several years, the macroeconomic growth picture in the U.S. has been the envy of other major economies. Europe, on the other hand, has had a more stagnant growth outlook (certain geographies experienced a technical recession late last year) and has also been impacted more directly by first-order impacts of geopolitical dynamics with closer proximity to their borders. While European private equity has underperformed U.S. private equity, it has generated a greater level of outperformance compared to its regional public equity benchmark, as shown below. Similarly, we are starting to see greater potential for upside in some segments of Europe, driven by a combination of more attractive valuation multiples and a faster easing of monetary policy outlook. Both of which should create a relatively more positive medium-term picture for certain assets in the right industries. Europe will, however, still likely see a wider dispersion across different geographies, so selection/tactical ‘deal picking’ will be paramount.
Historical U.S. & EU Private Equity IRR vs. PME Spreads
Still the most important chart: Just like David Byrne’s classic masterpiece whose theme inspired this article, below is another ‘oldie but goodie.’ Specifically, it tells you all that you need to know about private equity performance in different macro environments. While the road for investors has seen quite a few twists and turns more recently, this is the only map you need... Print it, frame it and don’t look back.
Performance Gap – Private Equity’s Average 4Y Outperformance by S&P Return Regime
All PE Average 4Y Excess Return by S&P Return Regime